

Power BI Desktop is a powerful business intelligence and data visualization tool developed by Microsoft. It serves as a comprehensive application for designing, building, and sharing interactive reports, dashboards, and data models. Power BI Desktop is a standalone Windows application that enables users to connect to various data sources, transform and shape data, create relationships between tables, and build visually appealing reports and visualizations. With Power BI Desktop, users can import data from a wide range of sources, including databases, spreadsheets, online services, and more. It offers a user-friendly interface with a drag-and-drop functionality that makes it easy to create interactive visualizations, such as charts, tables, maps, and graphs. The tool also supports advanced features like calculated columns, measures, and DAX formulas for performing complex calculations and data modeling.
Power BI Desktop allows users to customize their reports and dashboards with a rich set of formatting options, filters, and interactive elements. It provides a preview feature that allows users to see real-time updates as they design their visuals. Additionally, Power BI Desktop supports collaboration by enabling users to publish their reports to the Power BI service, where they can be shared with others for viewing and collaboration. Overall, Power BI Desktop empowers users to create compelling data visualizations, gain insights from their data, and effectively communicate their findings to stakeholders.
Getting Started with Power BI Desktop
Getting started with Power BI Desktop is easy. Here’s a step-by-step guide to help you begin:
- Step 1: Download and Install Power BI Desktop
Visit the official Microsoft Power BI website and download the Power BI Desktop application. Follow the installation instructions to install it on your computer.

- Step 2: Launch Power BI Desktop
Once the installation is complete, launch Power BI Desktop by clicking on the desktop icon or finding it in your applications menu.
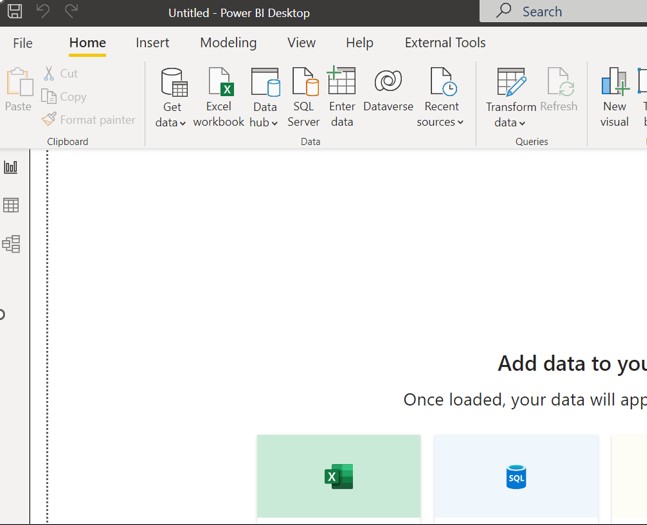
• Step 3: Connect to Data Sources
In the Power BI Desktop, click on the “Get Data” button on the Home tab. Select your desired data source from the options available, such as Excel, SQL Server, SharePoint, or web services. Follow the prompts to connect to your data source and import the data.

- Step 4: Transform and Shape Data
After importing your data, you can use the Power Query Editor to transform and shape the data as needed. This includes tasks like cleaning up data, removing duplicates, merging tables, creating calculated columns, and more. The Power Query Editor provides a user-friendly interface for these data preparation tasks.
- Step 5: Create Visualizations
Once your data is transformed, go to the Report view in Power BI Desktop. From the Visualizations pane on the right, select the type of visualization you want to create, such as a bar chart, line chart, or map. Drag and drop fields from your data onto the visualizations to populate them. Customize the visuals by applying formatting, adding titles, and adjusting settings.

- Step 6: Add Interactivity and Filters
Enhance your reports by adding interactivity and filters. Use the Fields pane on the right to add fields as slicers, allowing users to filter the data dynamically. You can also add drill-through actions, tooltips, and interactive elements to make your reports more engaging.

- Step 7: Save and Publish
Once you’re satisfied with your report, save it in the Power BI Desktop file format (.pbix). You can then publish the report to the Power BI service to share it with others. Click on the Publish button in the Home tab, sign in to your Power BI account, and follow the prompts to publish your report.

These steps will help you get started with Power BI Desktop and begin creating insightful reports and visualizations.
Power BI Service
Power BI Service, also known as Power BI online, is a cloud-based platform provided by Microsoft as part of the Power BI suite. It allows users to publish, share, collaborate, and consume Power BI reports and dashboards over the internet. Power BI Service is designed to enhance the functionality and accessibility of Power BI reports beyond the capabilities of Power BI Desktop. Power BI Service offers several key features and benefits. First and foremost, it provides a central hub for managing and sharing reports. Users can upload their Power BI Desktop files (.pbix) to the Power BI Service, which then hosts and renders the reports for online consumption. This allows for easy sharing and collaboration with others, as reports can be securely shared within organizations or with external stakeholders.
In addition to sharing, Power BI Service offers interactive dashboards that provide a consolidated view of key metrics and visualizations. These dashboards can be customized and organized to create a unified view of business data. Users can pin visualizations from various reports onto dashboards, enabling quick and real-time access to critical information. Power BI Service also enables data exploration and analysis through its powerful interactive features. Users can apply filters, drill down into data, and perform ad-hoc queries to gain deeper insights. Additionally, Power BI Service supports natural language querying, allowing users to ask questions about their data in plain language and receive relevant visualizations as answers.
Another significant advantage of Power BI Service is its ability to schedule data refreshes. Users can define automatic refresh schedules for their datasets, ensuring that the reports and dashboards are always up to date with the latest data from connected sources. Furthermore, Power BI Service provides seamless integration with other Microsoft tools and services, such as SharePoint, Teams, and Excel. This integration allows for a cohesive and interconnected data ecosystem, enabling users to leverage their existing workflows and maximize productivity.
Overall, Power BI Service empowers organizations and individuals to leverage the full potential of their data by providing a secure, scalable, and feature-rich platform for sharing, collaborating, and analysing business intelligence.
Power BI Desktop vs Power BI Service